Blumio
Designing a dashboard for the first continuous blood pressure device
MVP Concept | ux design & research

Overview
Background
Blumio is the first wearable device to collect blood pressure readings continuously through radar. The device collects systolic and diastolic readings every 30 minutes. Blumio needs to create an MVP mobile activity dashboard concept that tracks and displays real time data in a delightful way that is actionable and easy to read.
The Problem
There is still uncertainty regarding the most optimal way to manage hypertension since each individual's cardiovascular 'rhythm' varies. Continuous tracking is crucial to gain an understanding of one's overall BP health but can be overwhelming to monitor. With the introduction of a continuous device like Blumio, how would users interact with multiple data readings throughout a 24 hour period? How might we provide actionable feedback to users while keeping them engaged?
My Role
I was one of two UX Designers working directly with our client which consisted of their CEO, Project Manager and CTO. My responsibilities included stakeholder interviews, user interviews & synthesis, hosting participatory design workshops, concept ideation and feature prioritization, usability testing, prototyping and low fidelity wireframes. Our concept was presented at Demo Day for the Highway One Accelerator Program.
Process
Identify MVP Goals
Before jumping into user research we worked closely with our stakeholders to narrow the scope of work to focus on the following goals:
1. Educate people on key metrics
2. Provide data that is helpful and not confusing.
3. Show visualizations of BP that give users actionable feedback.
4. Inform users about the importance and meaning of BP readings.
Discovery
From secondary research and stakeholder interviews, we hypothesized the importance in surfacing trends from BP readings so patients could better understand their overall BP health. With limited time to conduct user research and synthesis, we hit the ground running interviewing users diagnosed with pre-hypertension and high blood pressure as well as primary care physicians who have patients with HBP. Speaking with users about BP evolved into a deeper discussion about self-empowerment in understanding one’s health, maintaining trust in doctor relationships (and trust in medications) and overcoming uncertainty with one's long term health. As researchers it was important to remain sensitive and patient in our interviews. With over 16 hrs of qualitative research, we conducted affinity and journey mapping to uncover key insights and touch points.


Insights & Persona Development
From primary research, my partner and I discovered 5 key insights that guided our design exploration, focusing on the first 3 for our MVP concept
Creating a connection between BP and behavior is key
People distrust BP readings, context is important
There is power in trends to screen and diagnose
It’s important to be aware of reactive vs. proactive users
HBP is a silent killer, monitoring consistently is difficult
Solution
Our idea to address these problems was to create an interactive dashboard that would allow users to recognize how their lifestyle behavior is correlated to their cardiovascular health by comparing trends over various periods of time. This would also enable users to assess how effective those lifestyle changes actually are. The main groups of people who would benefit from this solution would be people who have high blood pressure and want to have a holistic understanding of their health. The primary business goal our solution addressed is Blumio’s position as a partner in a person’s cardiovascular health. The primary user goal our solution supports is allowing users to feel empowered to take control of their cardiovascular health.
Design studio: Participatory Design, Sketching User Flows & Wireframes
Below are a few sketches of our ideation process, from concept mapping to user flows and wireframes. Because we were pressed for time, we worked low fidelity and iterated on our higher fidelity wireframes following usability walkthroughs and participatory design workshops with our client.
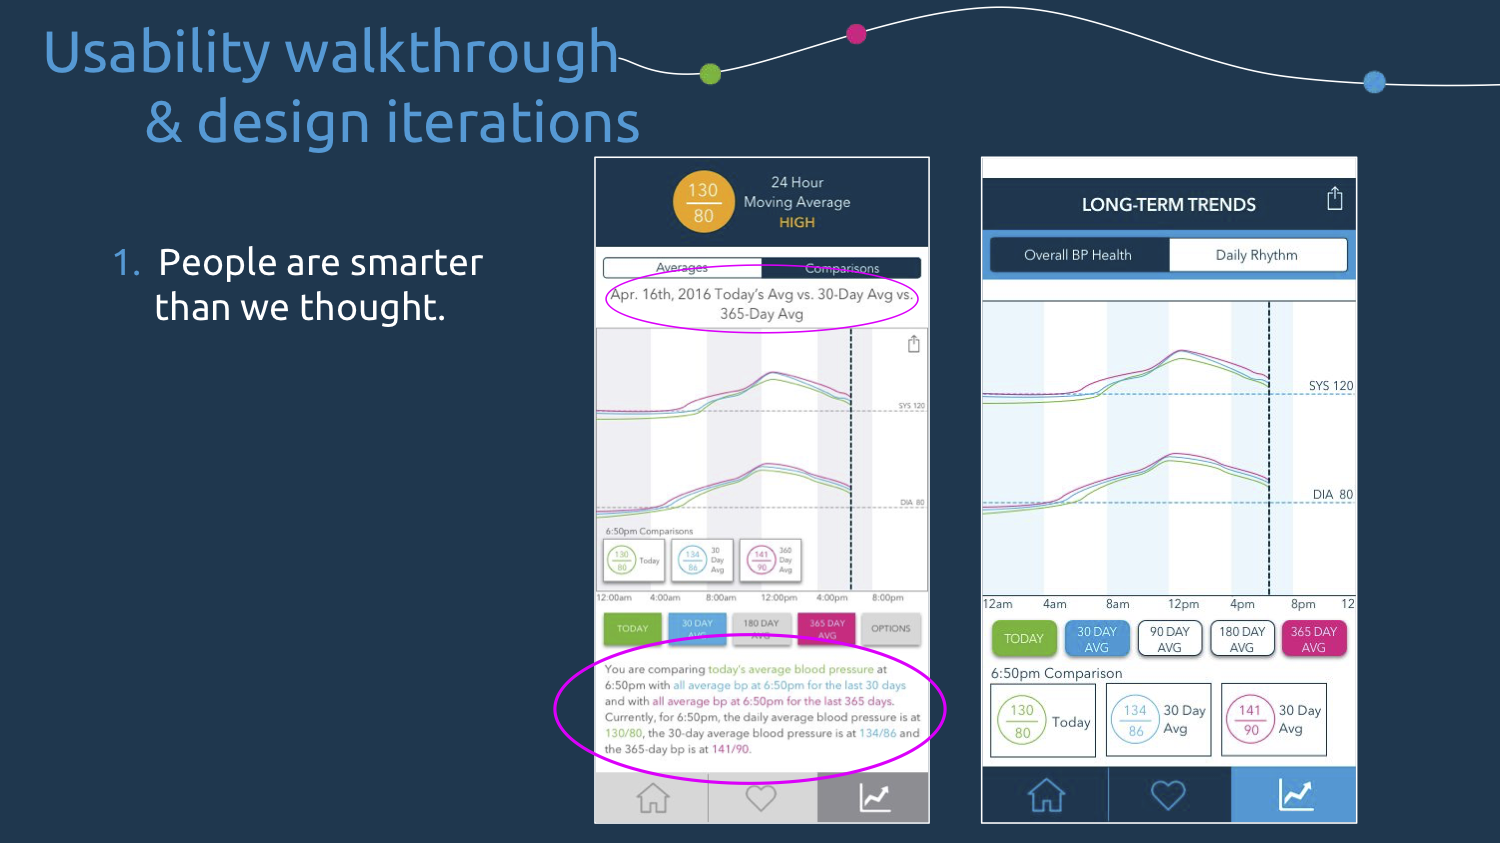
A few actionable insights we uncovered from usability walkthroughs were the following--
Moving average terminology was confusing and needed alternative microcopy
Averages are helpful for understanding overall health, but users still want access to exact readings. They want to know the device is working.
Users who track patterns are smarter than we thought, less can be more in dashboard comparisons


Solution
Main Screens
Our first solution enables users to easily track behavior with BP. The fab is a dominant feature in the BP health dashboard to motivate users to add, view and edit behavioral activities such as exercise and medication. We created a continuous, interactive chart that would highlight past activities and provide feedback so users could quickly scroll through and correlate a BP reading to the AHA’s guidelines as well as logged activities.
For users who might distrust exact readings because of prior experience with a cuff, we chose to highlight average comparisons on the summary and trends page to show progress over different lengths of time during different times of the day. From the summary page you can also easily identify areas of concern and what activities might be associated with them.

We decided to incorporate different time period averages across 24 hrs so users could make better sense out of the large amount of data the device collects. This allows a more glanceable view of BP patterns over time. By allowing users to compare and share data, we are further positioning Blumio as a partner in BP health while empowering users to understand their own personal daily BP rhythm and progress.
Reflection
Next Steps
Our suggested next steps involve solving more challenging user goals and needs regarding reactive users and medical devices. As Blumio grows, additional questions will need to be addressed—
How do wearables promote continuous engagement for reactive users? In particularly, for users like Eddie who may be early adopters but are not at a critical stage, how might we motivate them to continue tracking their progress?
How do you use data to further educate users about the long term impact of their behavior on their BP? How do you encourage reactive users to realize the dangers of not making the necessary lifestyle changes sooner than later?
Positioning onboarding as education is a major opportunity Blumio should leverage moving forward. Users do not necessarily understand the impact of continuous tracking yet. It will be important to set clear BP goals, medication tracking and reminder preferences for users to understand the value of monitoring trends and averages. We also recommend creating a chatbot or notification system to help make this silent killer more visible. A chatbot could help monitor meds more closely and ensure that users are taking the optimal amount while indicating in real time the correlation of medications and lifestyle choices to bp readings.
Thoughts
Although I don’t have a ton of foresight into where the medical device industry will go, I’m excited to contribute to solving some of the problems that will arise as health data collection becomes more prevalent, transparent and complex. Providing feedback in a consumer environment that focuses on the maintenance of one’s health will require organizations to design with care and sensitivity, and enabling patients to take appropriate action, without causing concern or stress, is a balance that I think can be achieved with meaningful designs.